Interactive Predictive Dashboards That Model How and for Whom Your Intervention* Works.
*Intervention: Whether you are tracking a physical product, a nutritional supplement, a clinical protocol, or a digital therapeutic.
Most companies sit on massive amounts of longitudinal user data, but struggle to actually show what it means. We bridge the gap between rigorous statistics and real-world utility. We take your data, run the right models, and build interactive dashboards that model the longitudinal associations of your intervention.
Apply for a Data Feasibility Review
Note: Not all datasets are ready for predictive modeling. We offer a complimentary, secure assessment of your data architecture to determine if your tracking infrastructure qualifies for a custom Interactive Effectiveness Dashboard.
See The Dashboard In Action
Test the dashboard below. This is not a static mockup; it is a custom statistical dashboard running locally in your browser. Adjust the variables to compute point estimates and 95% confidence intervals, demographic shifts, and trajectories in real-time. Note that every dashboard is custom-tailored; we can build these interactive filters for whichever specific data points matter most to your product’s effectiveness.
Completely Customizable & Fully Interactive
Every Interactive Effectiveness Dashboard is built from the ground up to match your brand’s identity and specific analytical needs.
Brand Integration & Customization
- Matching Your Aesthetics: The entire interface can be customized with your company’s specific color palette, typography, and logos.
- Light / Dark Mode: Deliver a premium experience with native toggling between Light and Dark interface modes perfectly tuned to your branding.
Fully Interactive Features
- Advanced Statistical Insights: Automatically calculates advanced benchmarks like Confidence Intervals, raw differences, POMP scoring, and Becker’s Δ / Cohen’s d.
- Instant Parameter Adjustments: Users can zoom into specific data clusters, toggle dynamic variables, and select granular populations on the fly.
- Export Beautiful PDFs: Generate clean, high-resolution PDF summaries with a single click—perfect for sending to stakeholders, B2B buyers, or legal teams.
Explore The Dashboard’s Capabilities
The interactive application above is divided into three distinct modules, designed to provide layered analytical depth for both executives and clinical teams.
Tab 1: Filtered Effectiveness Estimates
Examine the impact of the intervention on days it was used versus days it was not. Calculate dynamic outcomes, 95% Confidence Intervals, and quantitative clinical significance (POMP / effect sizes) tailored to specific demographic profiles.
Tab 2: Non-Linear Trajectories
Map non-linear associations over time or dosage to identify specific patterns in the longitudinal data.
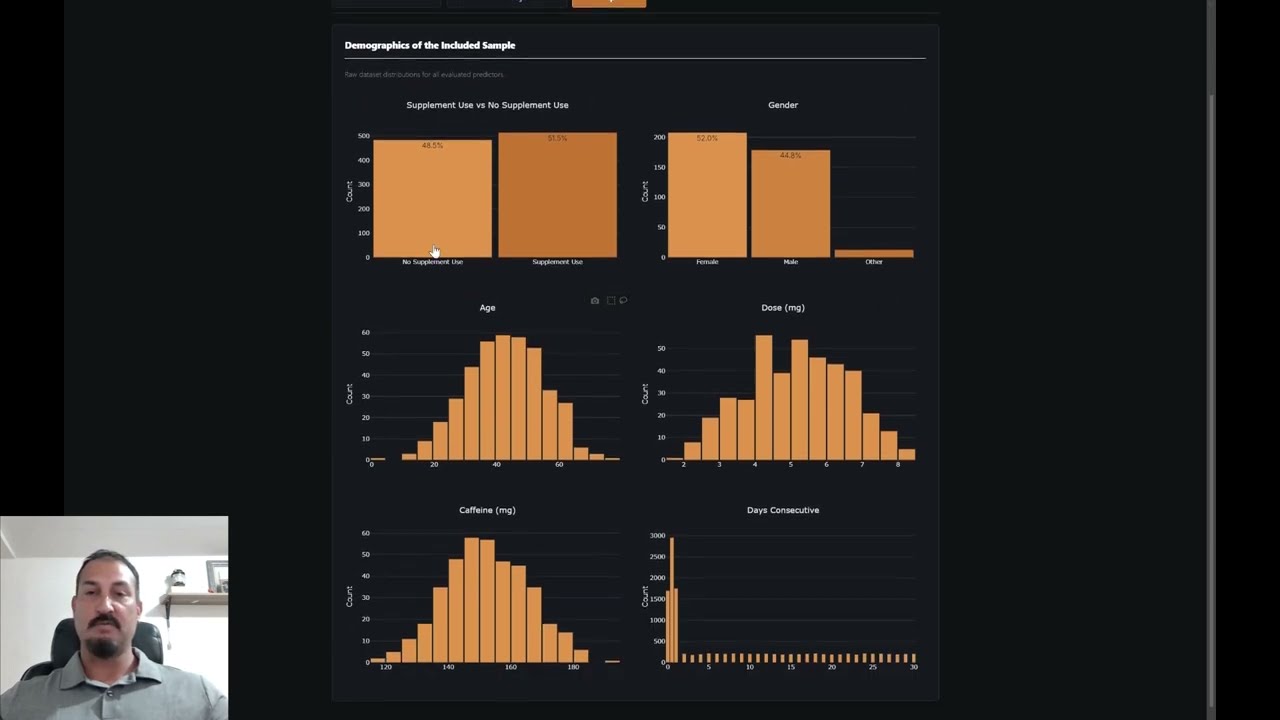
Tab 3: Predictor Details
Review the demographics and the distributions of the available predictors and the outcome.
How We Work With Your Data
We can handle the entire process from raw data to the final dashboard. However, if your internal team has already cleaned and structured your datasets, we can bypass the first stage and move straight into the statistical modeling to deliver your dashboard much faster.
1. Getting Your Data Ready (If Needed)
Real-world data is often chaotic. Users drop off, people miss check-ins, and app usage is inconsistent. If you are handing us raw exports, we will clean the data, appropriately handle the missing data points, and structure it properly so it can be analyzed over time correctly. If your data is already prepped, we skip this entirely.
2. The Right Statistical Model
We don’t force a one-size-fits-all approach. We look at how your data was collected—whether it is from a controlled trial, an A/B test, or just organic real-world users—and apply the correct statistical methods (like mixed-effects models) to isolate systematic treatment effects from residual measurement error.
3. The Interactive Dashboard
We don’t just hand you back a dense PDF report (although you can easily export a clean, condensed summary directly from the app). Instead, we code the final statistical models into a HIPAA-compliant, secure interactive web dashboard. You and your buyers can adjust the variables and see the outcomes visually, in real-time.
The Interactive Effectiveness Dashboard (How it Works)
Most health-tech dashboards rely on heavy, expensive servers or unpredictable AI. We engineered a specialized statistical dashboard that securely connects to your data backend.
Secure Data Architecture (HIPAA Ready)
Because the predictive matrix operates on a secure Supabase backend, sensitive health data is never exposed on the client side. Strict database isolation, no active third-party tracking, and rigorous compliance.
Instant Dashboard Updates
By executing the matrix algebra securely on the backend, the 95% Confidence Intervals recalculate in milliseconds when a user interacts with the dashboard. No long loading times or spinning wheels.
Standard Statistical Modeling
Our dashboard relies on Longitudinal Linear Mixed-Effects Models, ensuring results are reproducible and clinically sound.
Methodological Rigor
We do not use basic correlations. We use longitudinal mixed-effects models to isolate robust longitudinal associations.
Empirically Defensible Reporting
Unadjusted aggregate data and naive A/B testing can often be misleading. This model produces deterministic outputs suitable for rigorous empirical substantiation.
Our dashboard translates your complex, messy user data into deterministic, interactive dashboards. You get the analytical precision of a formal trial, delivered at the speed of a web app.
Separating True Patient Progress from Natural Score Fluctuations
Real-world consumer data is chaotic. Users skip days, take different doses, and have different baseline health metrics.
When standard data teams try to analyze this using basic correlations, the true impact of your product gets drowned out by the noise. Our proprietary Longitudinal Mixed-Effects Dashboard strips away the chaos. By comparing the average trajectories on days the product is used versus days it is not used, we identify the actual clinical impact of the intervention.
Scientific Authority
This dashboard is not standard web development. It is a custom statistical tool developed under the strict oversight of internationally recognized biostatisticians.

Bruce Wampold, PhD
Senior Statistician & Methodology Overseer
An internationally recognized psychotherapy researcher and authority in clinical outcomes. Bruce serves as the overarching Senior Statistician, providing strict methodological oversight for all predictive models developed by the team.

Aaron Del Re, PhD
Lead Statistician
A biostatistician and research psychologist specializing in complex longitudinal models. Having collaborated and published extensively alongside Dr. Wampold over the last two decades, Aaron translates their shared scientific rigor into secure, interactive web applications. He engineers the sophisticated underlying statistics that drive the interactive dashboards.
Request Feasibility Review
Our team will review your structural data requirements and confirm the correct tier within 24 hours.