
Longitudinal Data Auditor
Audit repeated-measures CSVs locally on your computer before fitting a single mixed-effects model. Catch structural blockers, disguised -99/999 missing codes, impossible scale typos, duplicate timepoints, cluster anomalies, and calendar drift—and export clean datasets with a verified Before-vs-After Remediation Certificate.

Tab 1 — Master Audit: Instant 0–100 (A–F) readiness grading, role-broken-down column profiling, unconditional REML and logistic random-intercept ICCs, pre-to-latest change preview, and row-referenced diagnostic tiers.
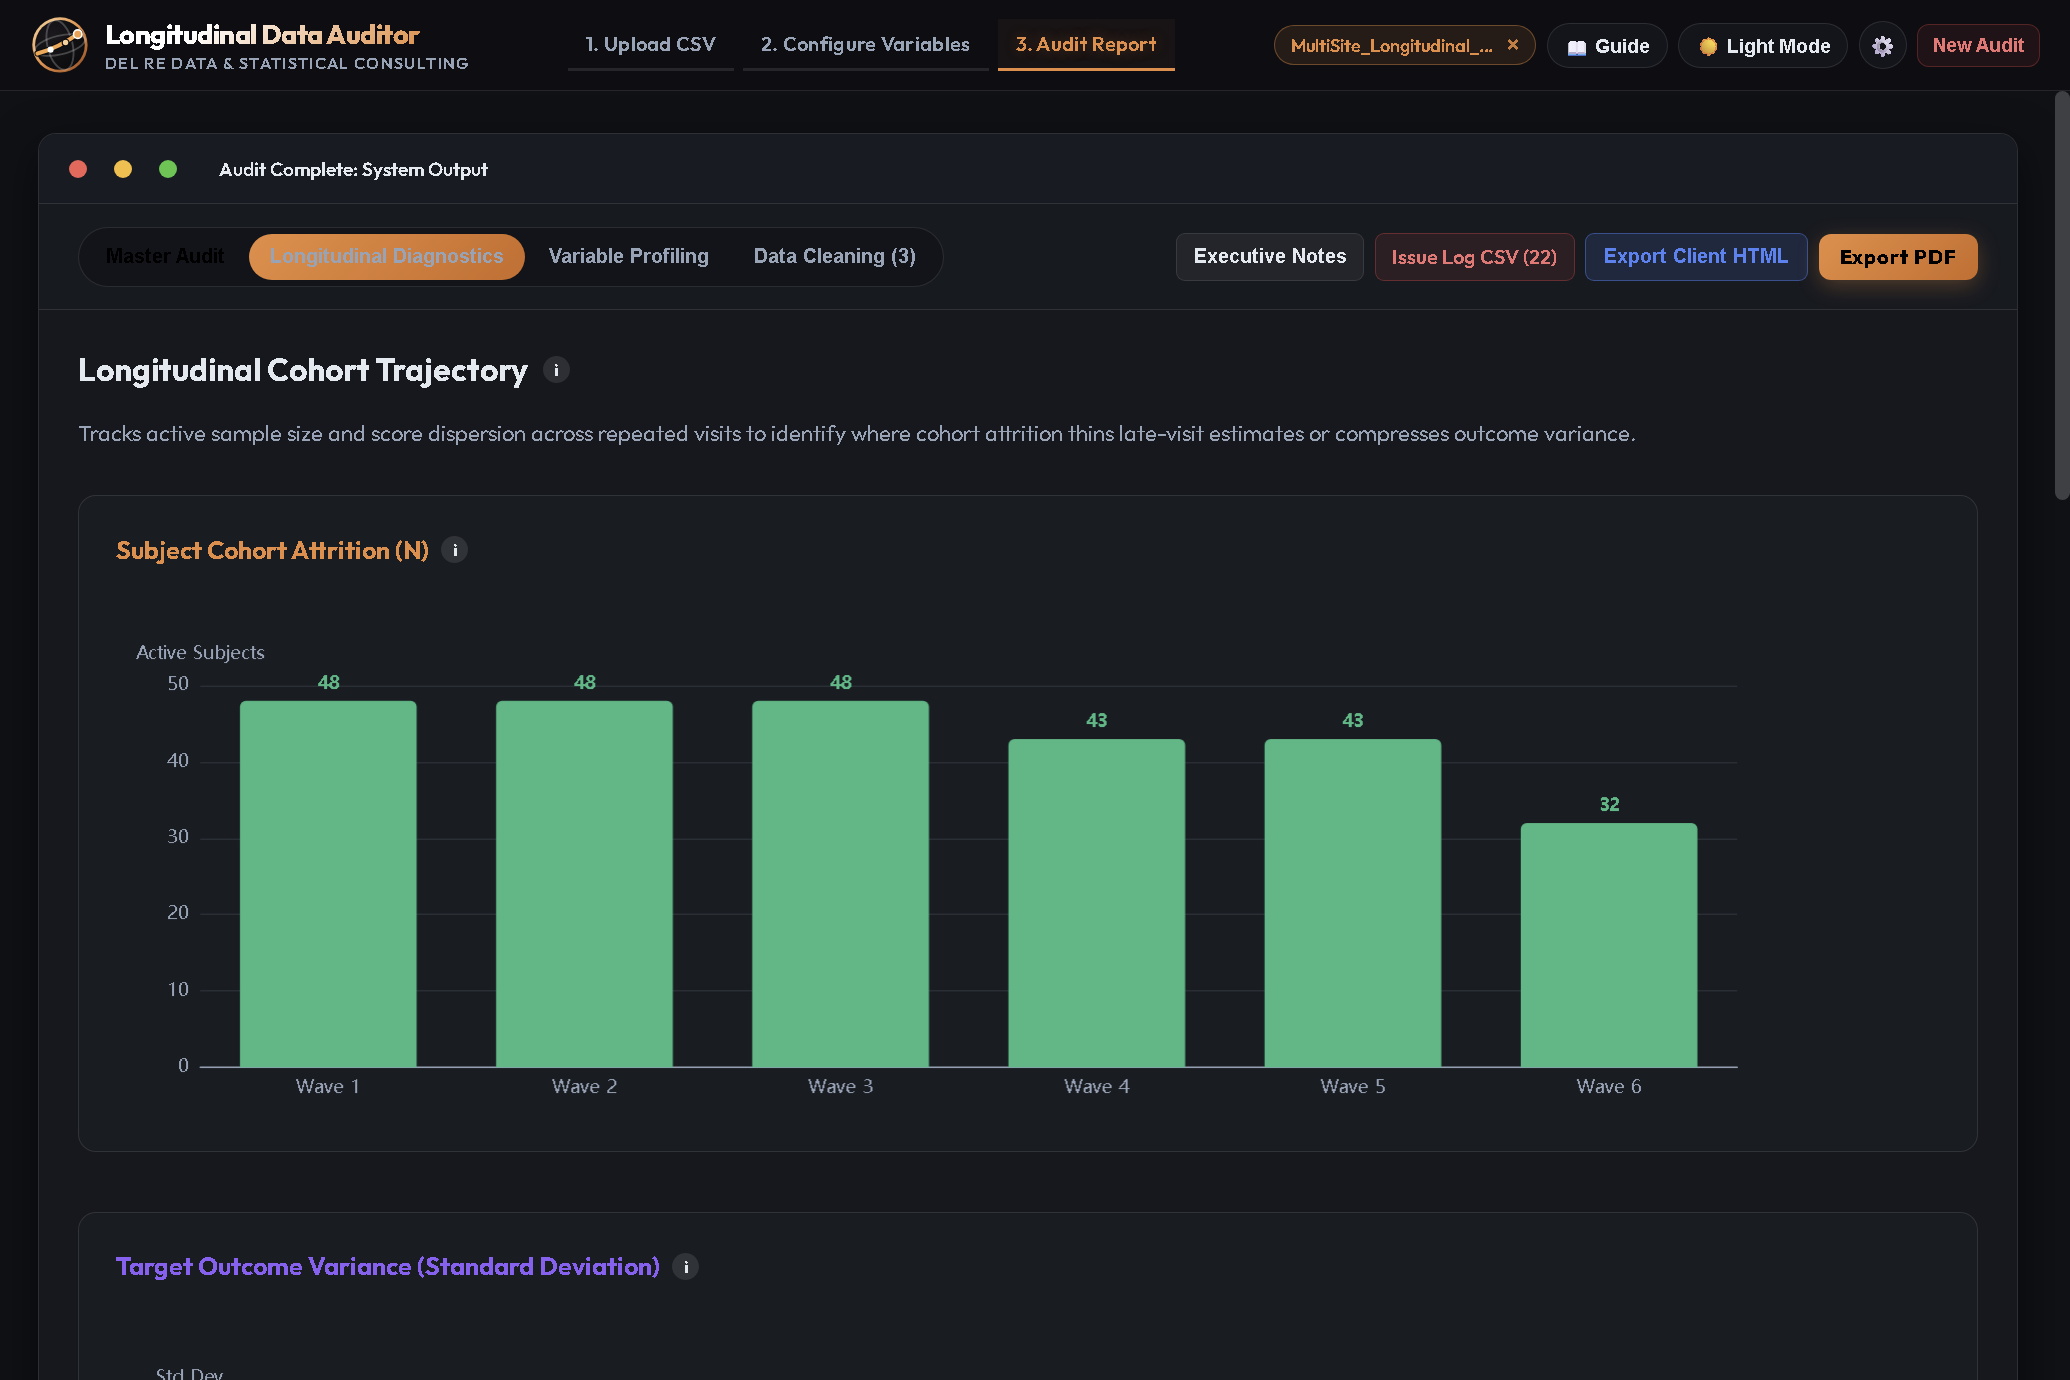
Tab 2 — Longitudinal Diagnostics: Tracks active sample retention by wave (Subject Cohort Attrition), outcome standard deviation over time (heteroscedasticity check), mean trajectories, and 3-axis monthly/quarterly calendar stability.

Tab 4 — Data Cleaning & Verification: Safe data-entry fixes turn on automatically (defaulting impossible entries to NA), while cohort/predictor cuts and covariate-only imputation remain strictly off unless chosen—paired with a 1-page Before-vs-After Remediation Certificate.
Why Repeated-Measures CSVs Quietly Break Mixed Models
In clinical trials, hospital cohorts, psychology labs, education panels, and consulting projects, most modeling headaches happen before R ever fits a random intercept.
Disguised Sentinels & Impossible Typos
Numeric missing codes like -99, 888, or 999—or a single keystroke typo of 48 on a 0–40 scale—parse cleanly as numbers in R and silently pull fixed-effect slopes, random-slope variances, and histograms off course.
Nesting, Small Clusters & Attrition
Ignoring higher-level site, school, or clinician clustering (Level-2 ICC > 0.05), fitting asymptotic standard errors with fewer than 40 clusters instead of CR2 / Satterthwaite degrees of freedom, or overlooking baseline-severity dropout distorts Type I error rates.
Unrecorded Spreadsheet Edits
Manual cleanup across scattered scripts or spreadsheets makes it difficult to document for co-authors, reviewers, IRBs, or organizational clients exactly how many cells were recoded to NA, deduplicated, or excluded—and to prove that observed outcomes were never imputed.
What Longitudinal Data Auditor Checks & Computes
Opens in General Longitudinal Mode by default for any repeated-measures study across biostatistics, psychology, medicine, education, or panel surveys, with plain-English i explanations on every metric and table header.
Four-Dimension 0–100 (A–F) Audit Score
Evaluates every uploaded dataset across four transparent psychometric and longitudinal dimensions (with a full in-app Grading Table showing exact point deductions):
- Integrity (Binary Gate): Immediately flags structural blockers (
0 F) such as cross-sectional 1-row-per-ID wide files, fewer than 2 subjects, missing or all-text mandatory columns, or constant primary outcomes. - Design / Accuracy: Checks cluster counts, random-effects ICCs, predictor collinearity (
|r| > 0.85), reverse-scored outcome redundancy (|r| > 0.95), and sample-to-predictor or minority-event-to-predictor ratios. - Completeness: Tracks primary-outcome and within-subject trajectory missingness alongside single-visit attrition so clean covariates never mask a sparse primary outcome.
- Consistency: Flags out-of-bounds values, disguised missing codes, text entries in numeric columns, duplicate
(ID, Time)visits, out-of-order calendar dates,>90-day gaps, and high-cardinality factors.
2-Level & Nested 3-Level ICCs + Change Preview
Estimates variance partitioning and unadjusted pre-to-latest change before you write model syntax—automatically stripping out-of-bounds entries and sentinel codes first:
- Continuous Outcomes (REML): Fits unconditional 2-level (
Subject ICC,Between-Subject SD,Within-Subject SD) and 3-level nested (Level-2 Cluster ICCtested against the 2-level null) models. - Binary
0/1Outcomes (Adaptive Quadrature): Fits 2-level and nested 3-level unconditional logistic random-intercept models via mode-centered Adaptive Gauss-Hermite Quadrature on the π2 / 3 latent logistic scale, plus minority-class event counts. - Small-Cluster & Dropout Guards: Flags boundary/singular fits,
<40-cluster small-sample degrees-of-freedom needs (CR2/ Satterthwaite / Kenward-Roger), and baseline-outcome correlation r with visit count (MARattrition check). - Pre-to-Latest Change Preview: Computes bias-corrected
Hedges' g(95% CI accounting for pre-post r) and paired gz for continuous outcomes, or paired percentage-point event-rate shifts (Agresti-Min 95% CI) for binary0/1outcomes.
Cluster Anomalies, Waterfall & Calendar Drift
Adapts clinical-trial central monitoring checks (inspired by dataquieR and CluePoints) to multi-site, multi-rater, school, and clinic datasets:
- Leave-One-Out Cluster Monitoring: Compares each site, rater, or clinician against peers to spot
>=85%single-score straight-lining,<0.25xpeer SD compression (Near-Zero SD), and0/5or whole-integer.0terminal-digit rounding (Digit Heaping). - Diagnostic-Only Sudden Jumps: Flags abrupt within-subject swings (
>4within-person SD) for row-level inspection inAudit_Issue_Log.csvwithout ever auto-deleting genuine clinical shifts. - 3-Axis Calendar-Time Stability: Plots monthly (
YYYY-MM) or quarterly (YYYY-Q#) visit counts, outcome averages or event rates, and variable missingness to catch EHR migrations or mid-study form changes. - Sample-Loss Waterfall & Bounded Histograms: Tracks exact subject retention step by step and renders scale-bounded continuous histograms and discrete category bars.
Analyst-Controlled 3-Group Data Cleaning
Separates clear data-entry repairs from substantive modeling choices so nothing is dropped or imputed behind your back:
- Group 1 — Safe Data-Entry & Header Fixes (Auto-ON When Flagged): Converts text typos and disguised
-99/999sentinels toNA, resolves out-of-bounds scores (defaulting to Convert to Missing (NA) rather than fabricating ceiling scores, with optionalCap to Boundary), merges duplicate(ID, Time)rows, cleans column headers, and drops zero-variance predictors. - Group 2 — Cohort & Predictor Rules (OFF by Default): Optional
>90-day />6-wave episode splitting (_Ep1,_Ep2), collinearity pruning, rare-category collapsing, predictor-ratio screening, and minimum-visit thresholds. - Group 3 — Covariate-Only Imputation (OFF by Default): Optional
LOCFor Damped Linear Extrapolation (DLE) strictly restricted to covariates—mapped outcome columns are locked out of imputation in both the interface and the R cleaner.
Five Reproducible Deliverables From Every Session
Export clean documentation for supplemental files, data-management archives, co-investigators, or external consulting clients in one click.
Audit_Issue_Log.csv
Every flagged cell and longitudinal anomaly with its exact CSV row number, subject ID, timepoint, observed value, issue category, and plain-English explanation (with spreadsheet formula-injection neutralization).
Interactive HTML & Portrait PDF
Self-contained offline Light-Mode Data_Auditor_Report.html (with custom Organization Name, consultant Executive Notes, and interactive hover tooltips—omitting internal cleaner switches) plus formatted multi-page Data_Auditor_Report.pdf.
Cleaned CSV & Remediation Certificate
Exports Data_Auditor_Cleaned.csv alongside a 1-page Data_Remediation_Certificate.html generated by re-profiling the cleaned file in R-Portable—reporting Before-vs-After readiness scores and an explicit Verified Zero Outcome Imputation attestation.
How Longitudinal Data Auditor Compares
Built specifically for repeated-measures panel structure—without uploading sensitive human-subjects or patient records to external servers.
| Capability | Longitudinal Data Auditor | Generic CSV / Data Profilers | Ad-Hoc R / Python Cleaning Scripts |
|---|---|---|---|
| 100% Local & Offline Execution | Yes — Bundled R-Portable on 127.0.0.1; zero cloud transmission |
Often browser/cloud SaaS or requires Python setup | Local, but tied to local package versions |
2-Level & Nested 3-Level ICCs (Continuous & Binary 0/1) |
Built-in REML & Adaptive Quadrature logistic ICCs + <40-cluster CR2 notices |
Treats rows as independent cross-sectional records | Manual model coding per study |
| Disguised Sentinel & Scale-Bound Masking Before Stats | Automatic masking of -99/999 & out-of-range typos across ICCs, correlations, and histograms |
Averages raw sentinel codes into means & SDs | Easy to miss on uninspected covariates |
| Cluster / Site Central Monitoring & Calendar Drift | Leave-one-out straight-lining, near-zero SD, digit heaping & 3-axis monthly/quarterly drift | Not available | Rarely coded before primary analysis |
| Before-vs-After Remediation Certificate & Zero-Outcome-Imputation Lock | 1-click HTML certificate re-profiled in R + hard lock preventing outcome imputation | No longitudinal certificate | Requires custom reporting scripts |
Includes an Optional Preset for Outcomes Predictive Suite Clinics
While Longitudinal Data Auditor opens in General Longitudinal Mode for any academic, medical, educational, or consulting dataset, outpatient behavioral health clinics using Outcomes Predictive Suite can toggle on the built-in clinical preset via the top-right ⚙️ menu to check Session 1–3 intake baselines, optional session alliance measures (SRS, WAI), clinician protocol compliance, and 10:1 client-to-predictor calibration thresholds.